 Dimension Trader LLC
Day Trading Systems, Education & Training - Award Winning Training
Treat your trading as a business!
Questions? Contact:
Mike Green
(513) 442-3031
Email:
mike@traderusa.net
Skype mdgtrader
 |
Our ATM Master can take any signals (Up to 5) on your screen and execute the trade and be managed by any ATM You create. |
 |
|
| Click on Indicator name to see the indicator | Short Description of what indicator does |
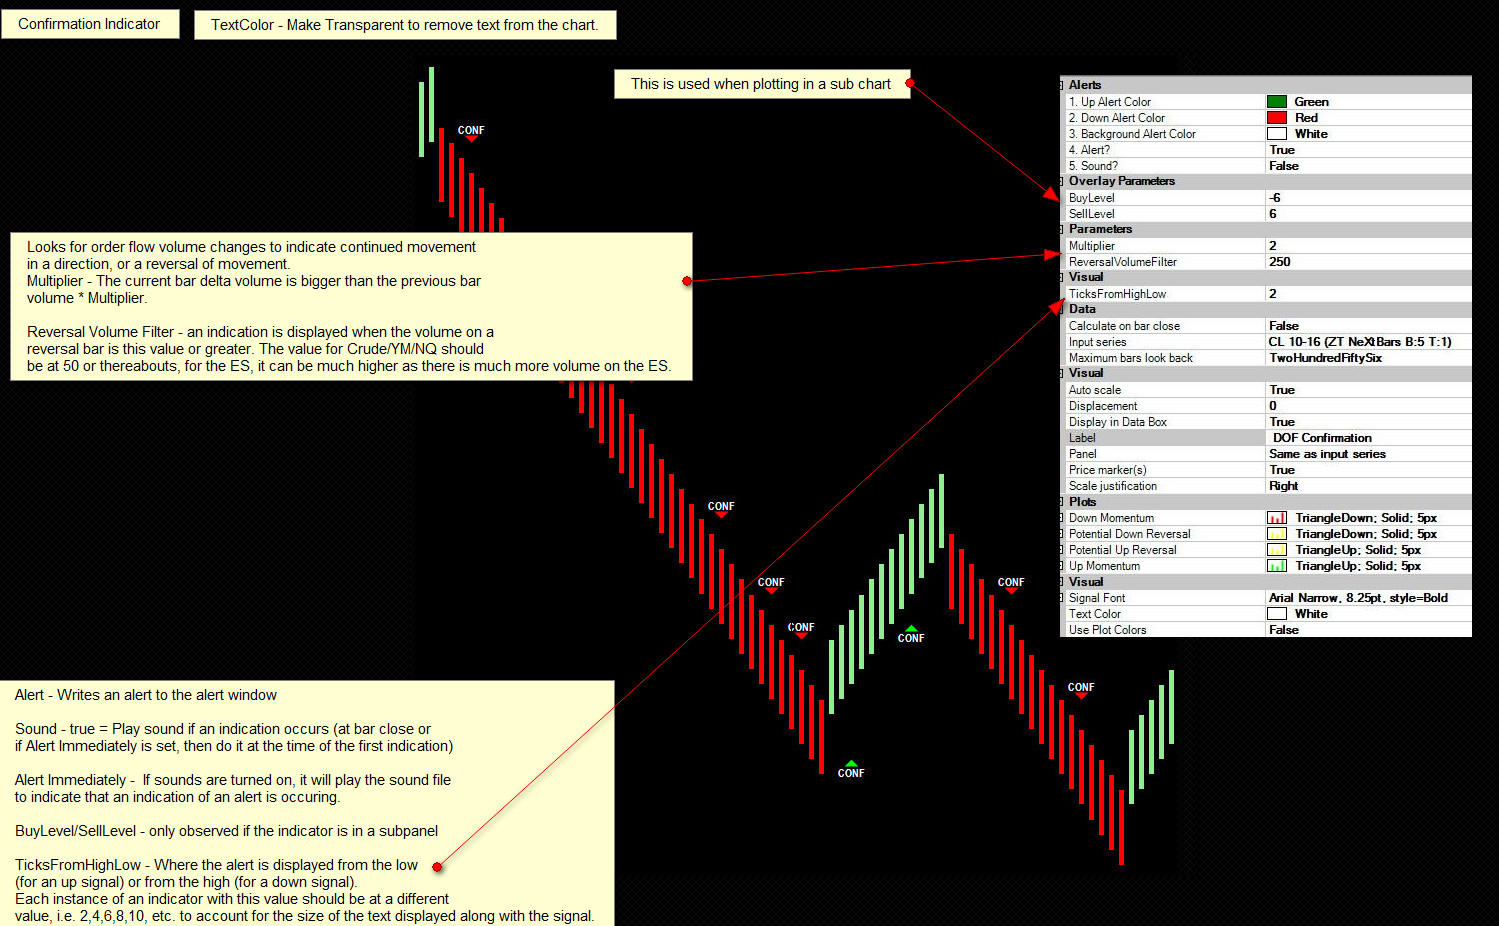 |
This indicator tells us when the buying/selling volume in the current bar is twice as big as the previous bar. This indicator may also display a yellow triangle indicating a possible turn in the price action. |
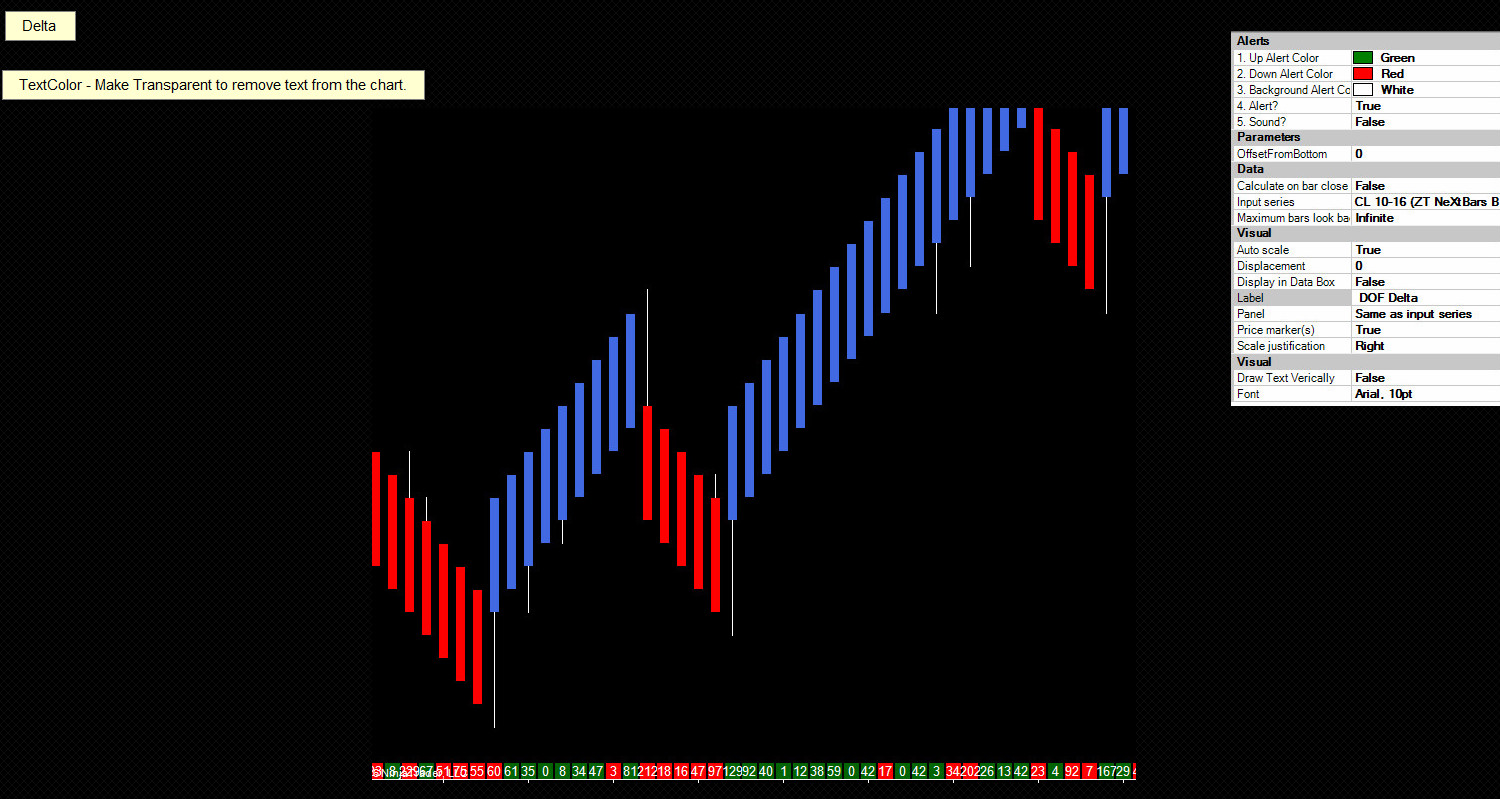 |
Tells us if there are buyers or sellers in the bar. It is the difference between buyers and sellers that gets displayed. |
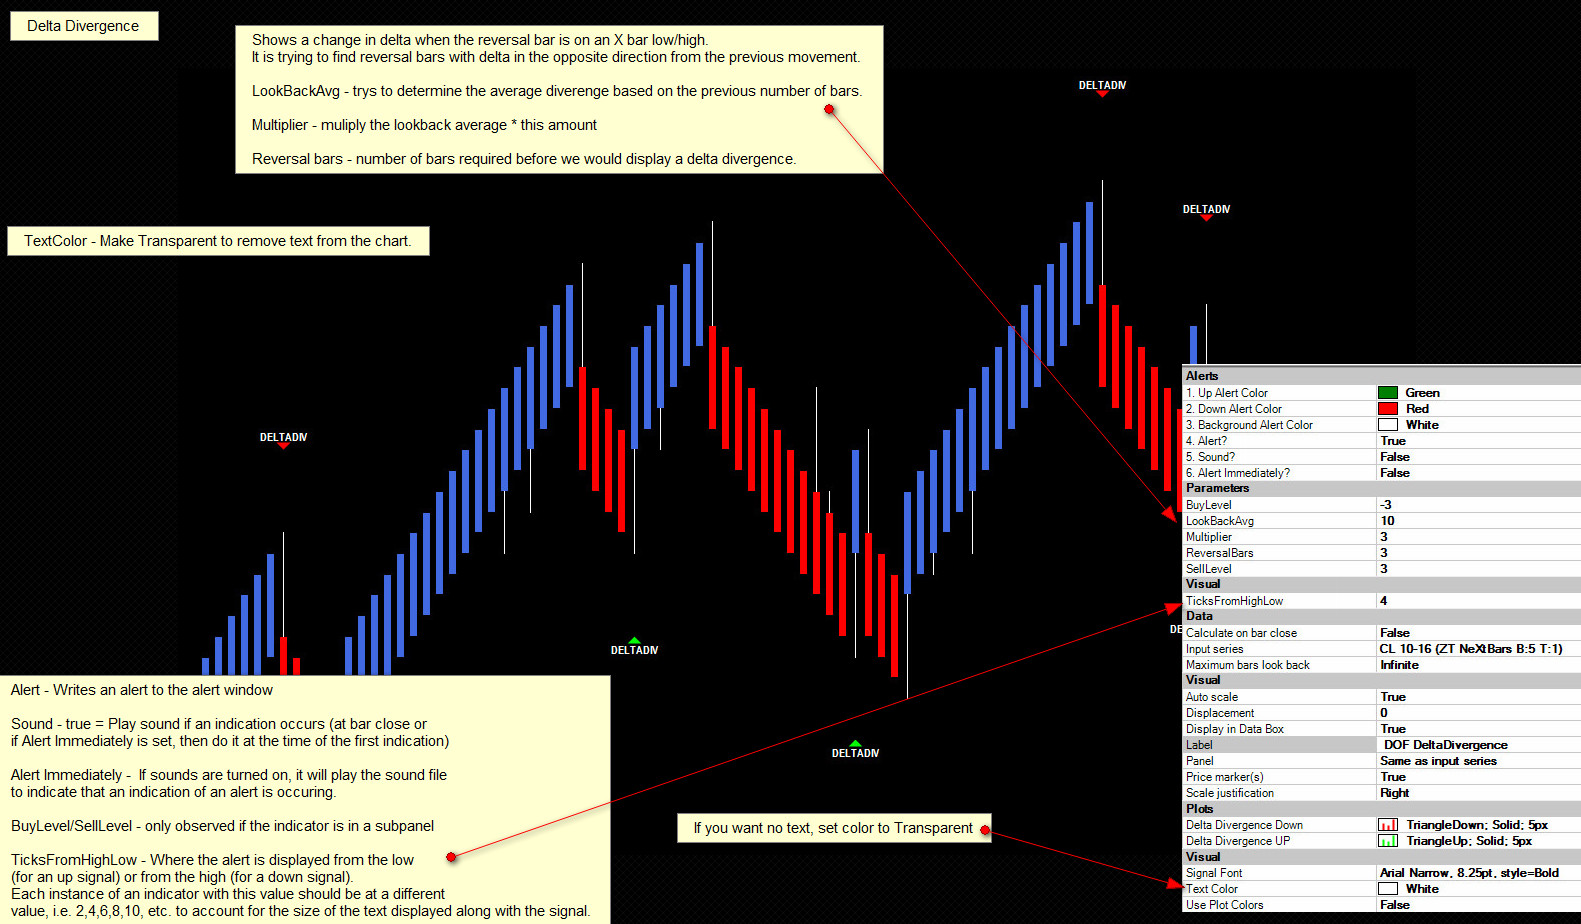 |
This indicator requires a lower low (higher high) than the previous X bars with a positive (negative) delta within the bar. |
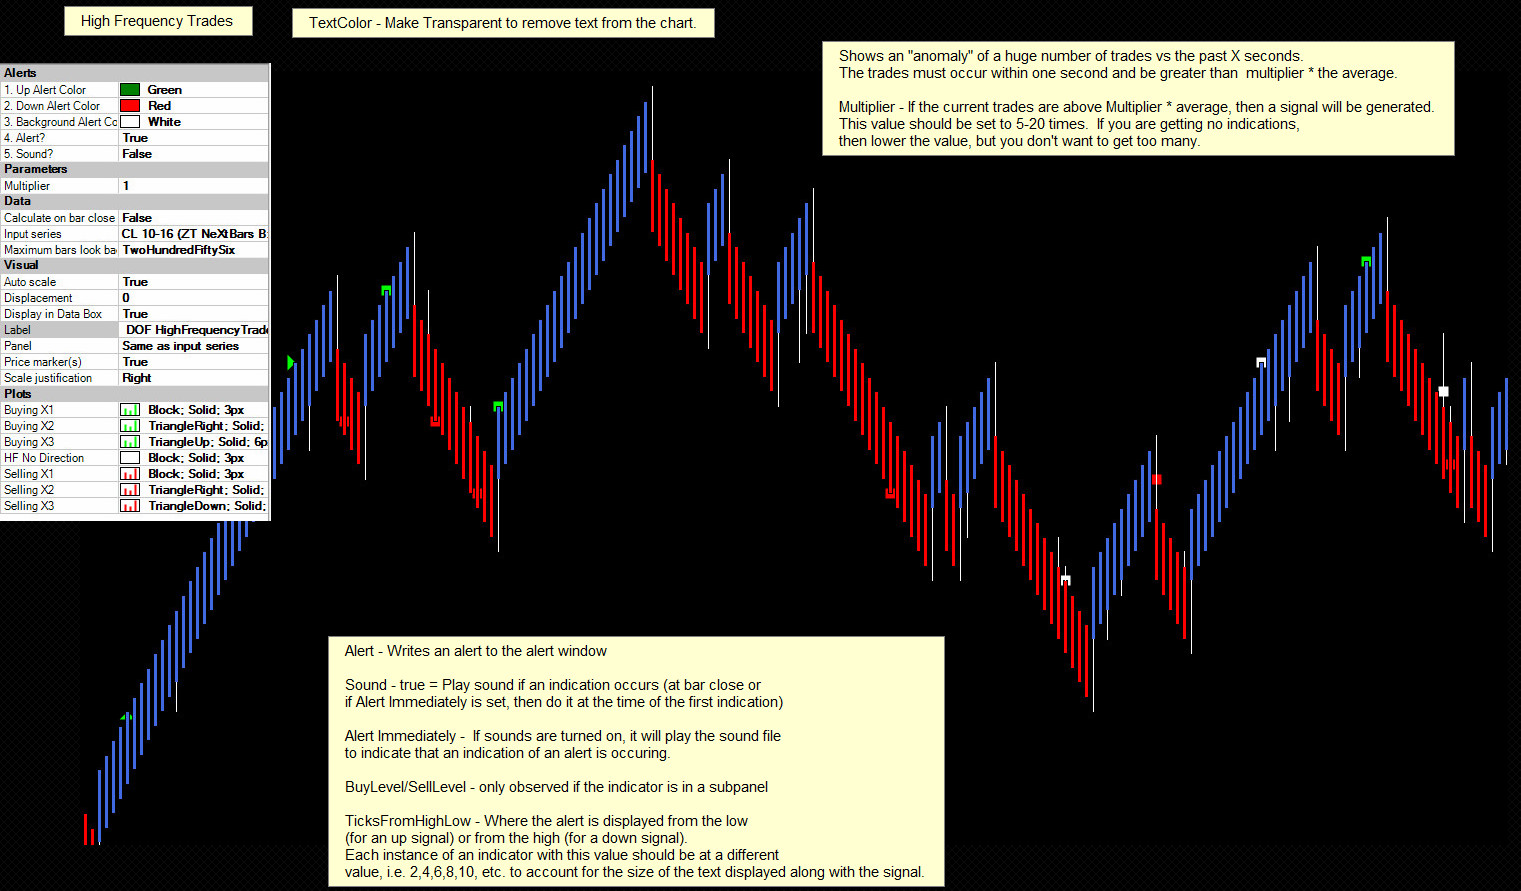 |
This indicator tells us when the trading activity in the current second is unusually large compared with the previous minutes trading transactions. Three levels different indications can be shown by this indicator. Calculations are made that define the level at HFT activity is present, call that X. A square represents the the number of trades in one second at or above X. A right triangle represents 2X trading activity and a up/down triangle represents 3X trading activity. |
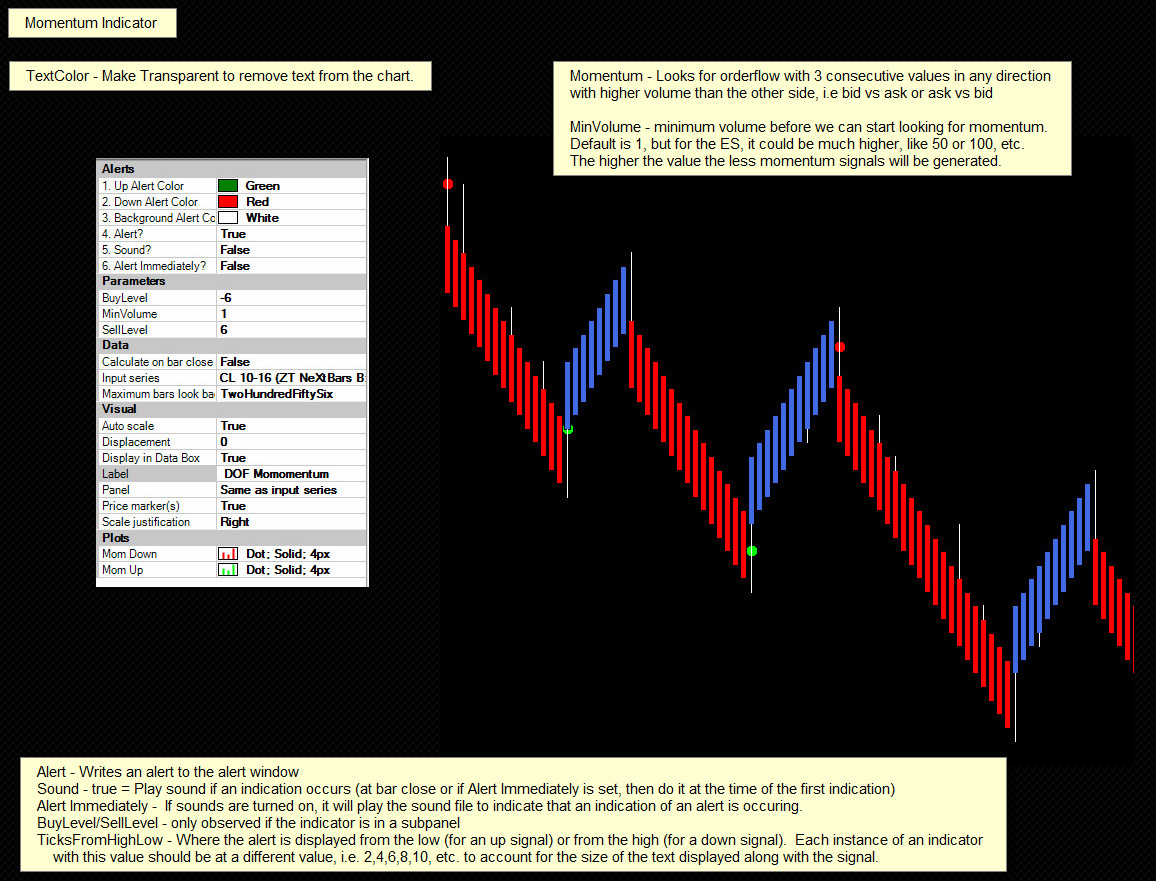 |
This indicator tells us when three consecutive price nodes have twice the volume indicating momentum in the corresponding direction. |
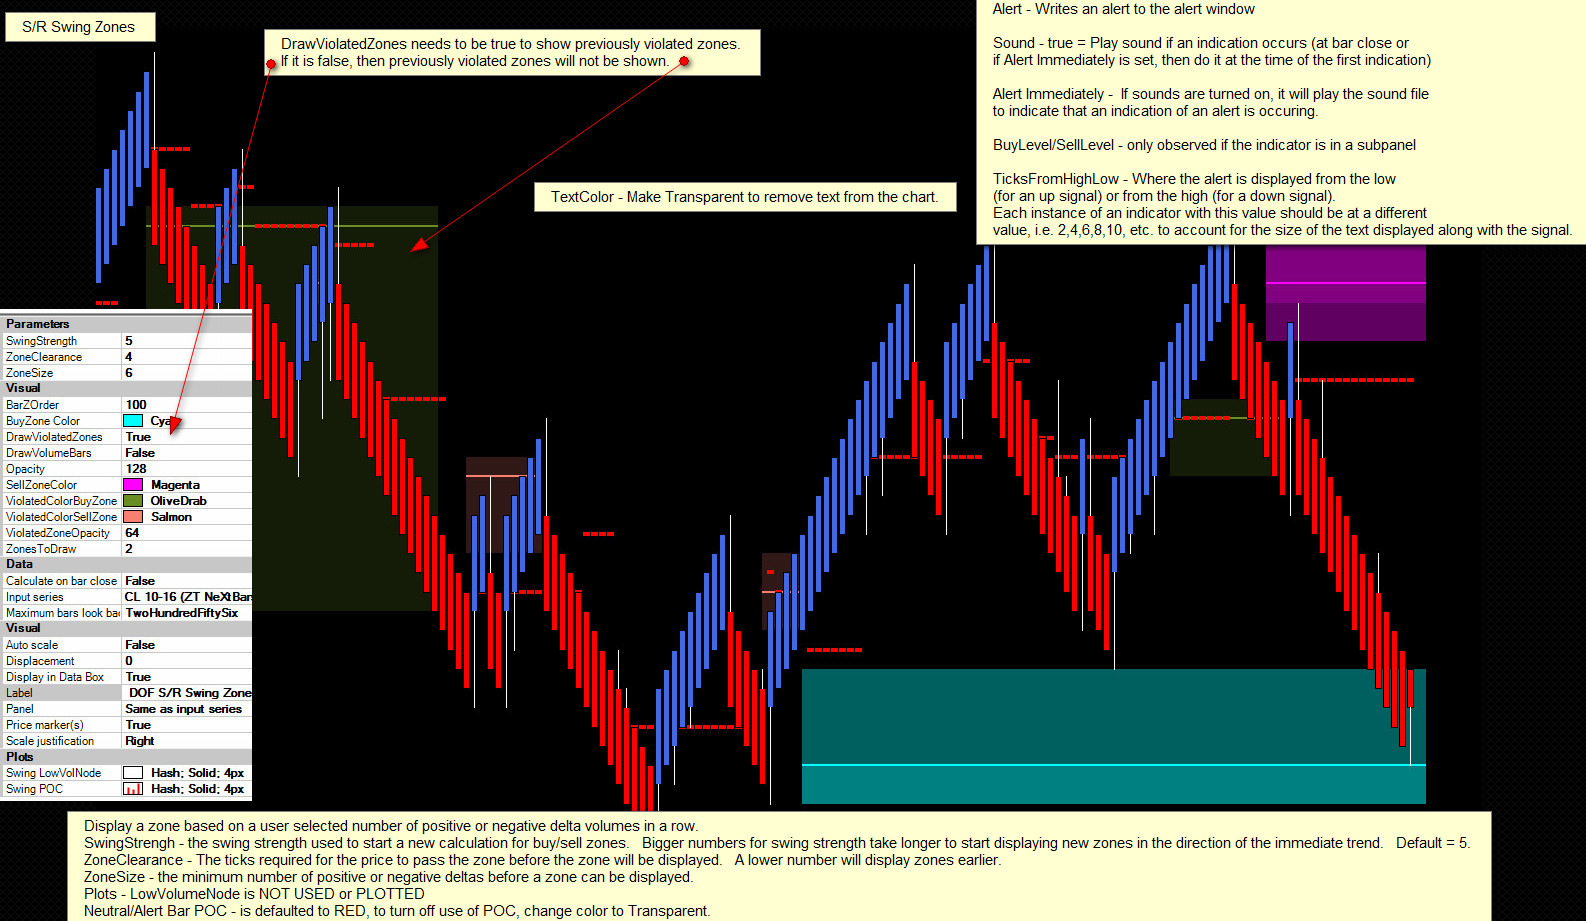 |
This indicator measures the buyers and sellers from the last swing, not just within an individual bar. It is configurable in that the width of the zones can be adjusted. It requires X consecutive prices to have more buyers than sellers (sellers than buyers) before it will plot a buy (sell) zone. The zones often come at turning points in the market, but can also occur within strong moves either up or down. Movements back into these zones make for good opportunities. |
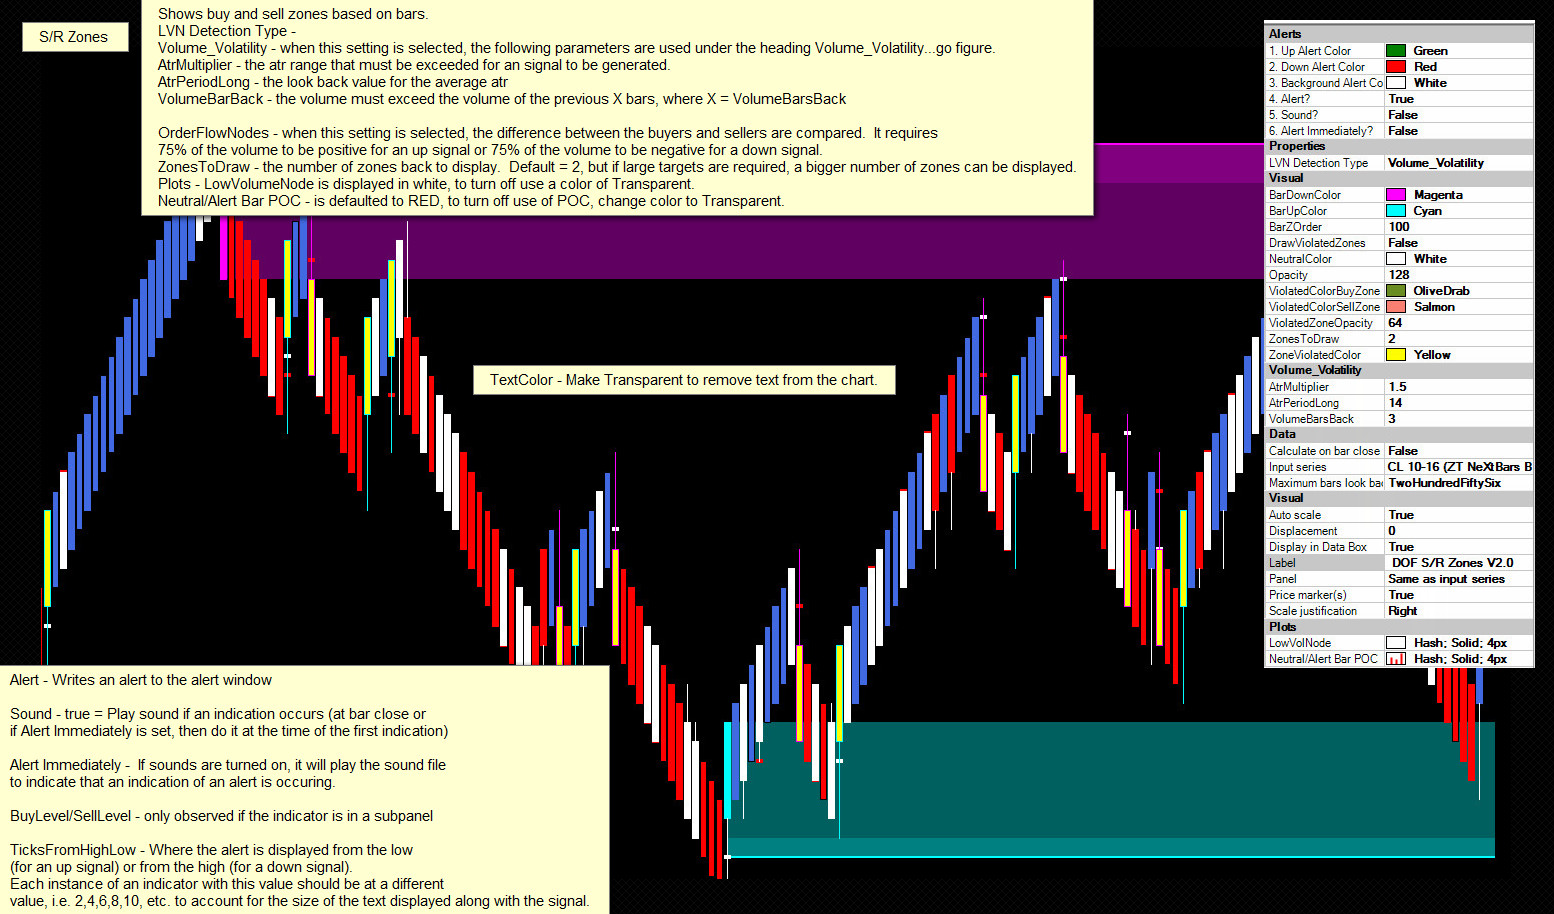 |
This indicator can use two different methods for determining the alert bar. One method is based on a majority of buy vs. selling levels within the current bar. The other method is based on volume/volatility. Zones are thus defined by the alert bar. The other colors are not based on total volume, but comparisons of buy/selling levels within the bar. White bars have equal buying/selling levels, while green bars have more buying and red bars have more selling. White bars indicate indecision and the point of control (POC) is shown on white bars. The alert bars, in addition, show POC and the LVN (low volume node). |
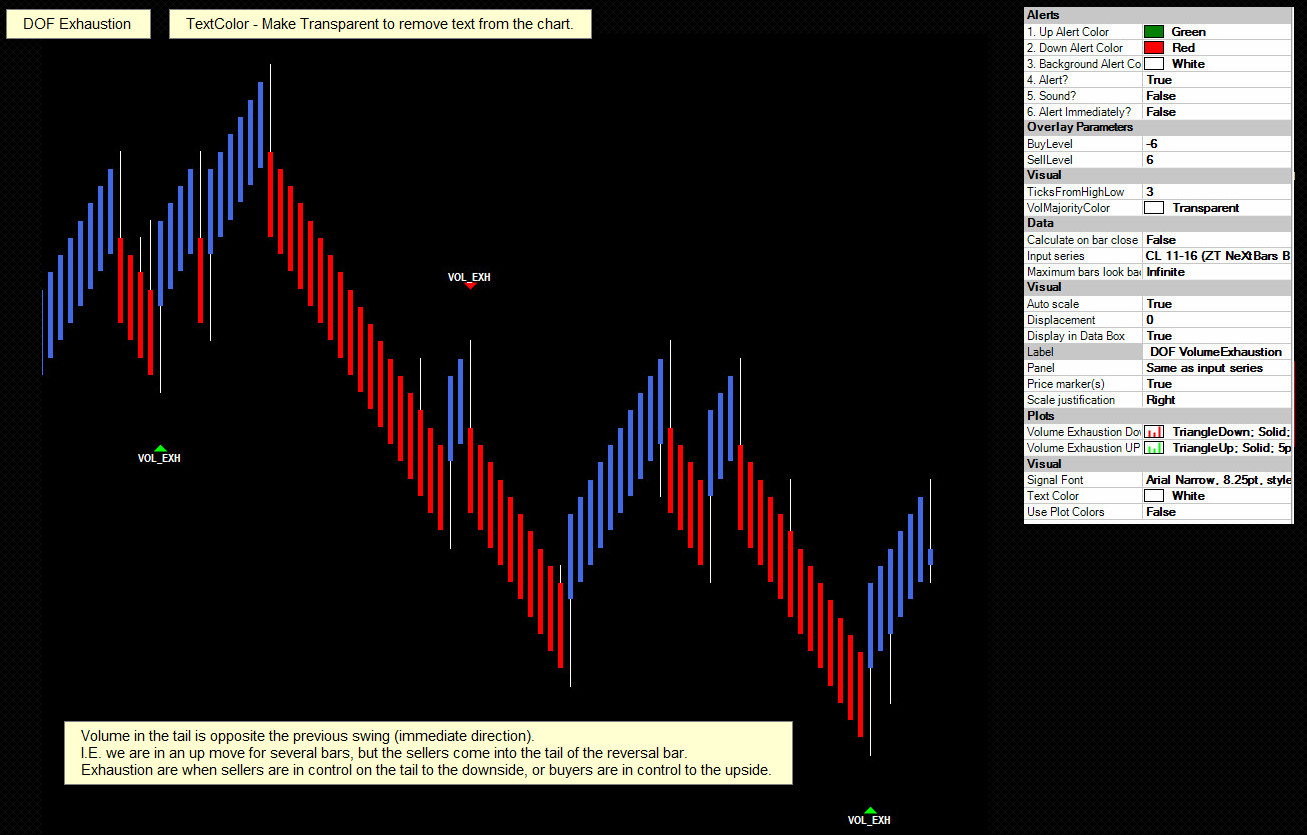 |
Shows us when the sellers/buyers have control in the tails of reversal bars to the downside/upside. The majority of the volume must also exist in the tail of the bar, so these indications are strong indications that the previous movement is being met with resistance/support. |
 |
Shows us when the sellers/buyers have control in the tails of reversal bars to the upside/downside. The majority of the volume must also exist in the tail of the bar, so these indications are strong indications that the previous movement is being met with support/resistance. |
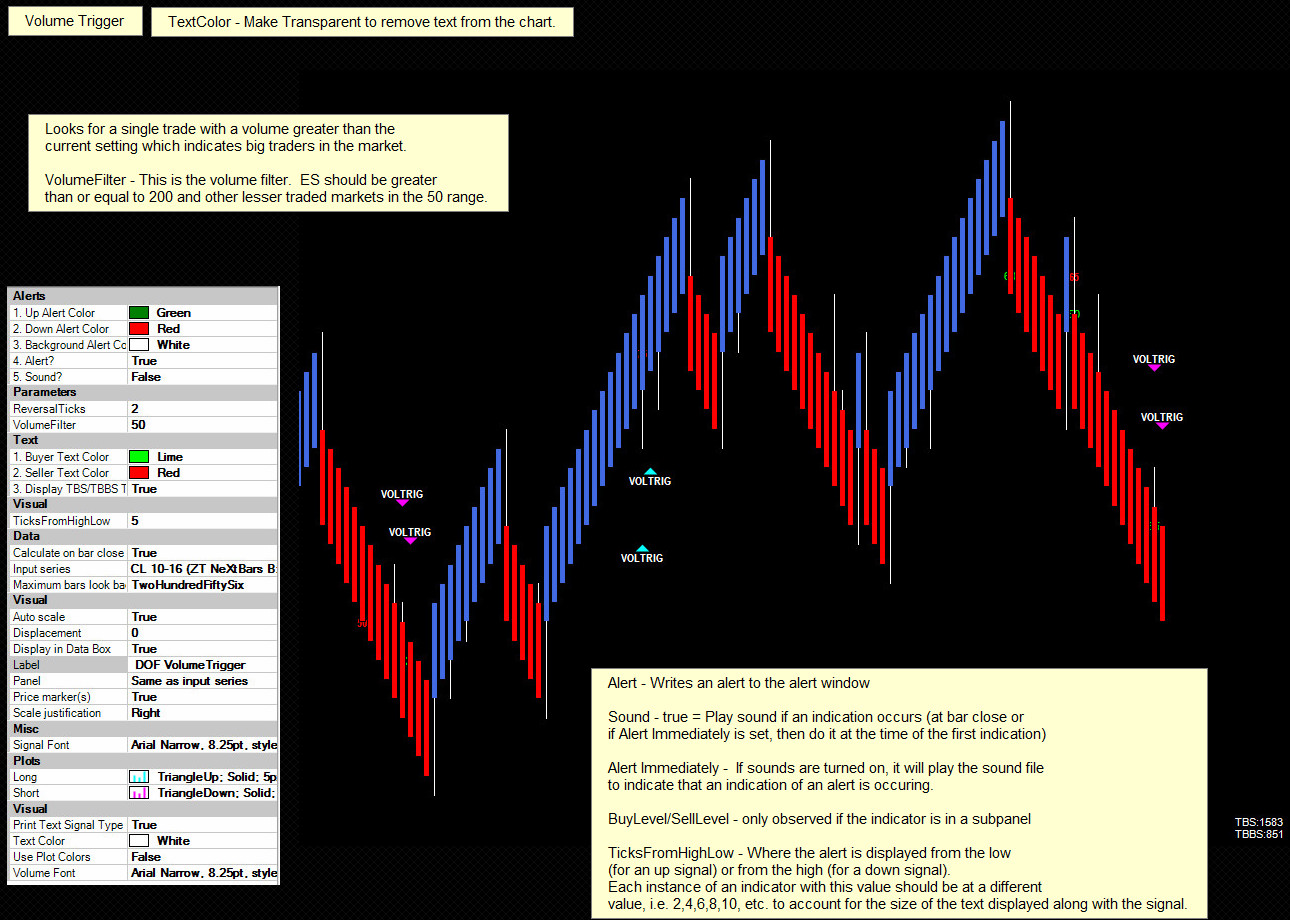 |
Shows when big buyers/sellers are coming into the market and where. Institutions and market makers come into the market during trading hours for several reasons. Sometimes it is to acquire positions and at other times it is to unroll previous positions. When single trades of 50 or more (configurable) contracts occur, this indicator will plot the number of contracts bought or sold. |
 |
Can be setup with up to 5 signal markers on the chart to fire an entry into the market. Once in the market the trade is managed with YOUR ATM Strategy. Targets and stops can be easily moved in Chart Trader |